
GBS by the Numbers: Why Many Leaders Stay Lean – and Some Scale Big

Posted by Barbara Hodge on February 26, 2026
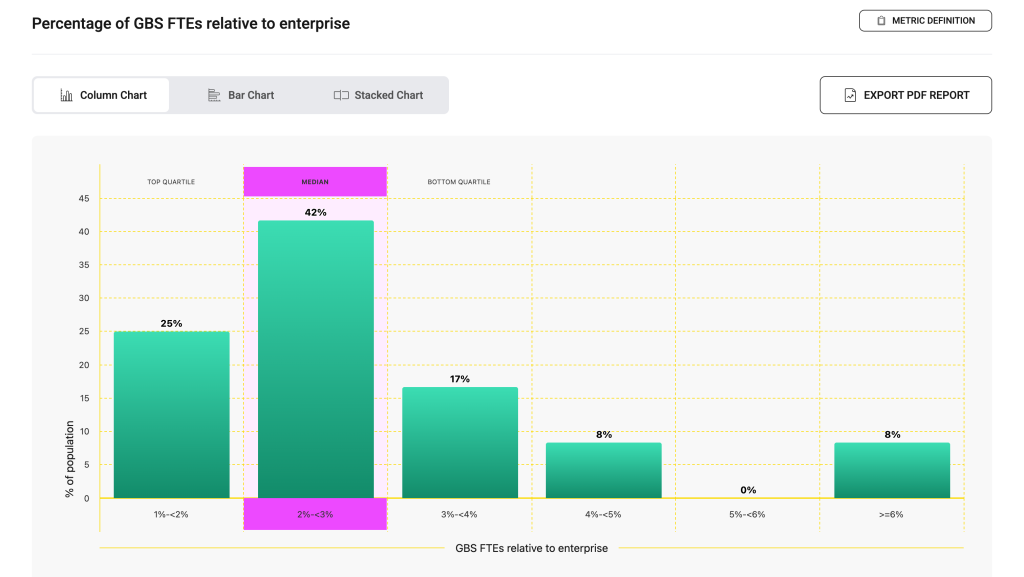
GBS FTEs relative to enterprise
Source: Research conducted across global GBS leaders, Q4 2025
The distribution shows that most leading GBS organizations operate with a relatively lean captive footprint: 67% report GBS FTEs below 3% of enterprise headcount, with the median in the 2-3% range (42%). This reinforces a structural reality in mature GBS models: centralization delivers disproportionate value relative to size. Even at ~2-3% of enterprise workforce, GBS typically supports a much larger share of transactional and increasingly knowledge-based processes. For leaders, this is a useful benchmark: a well-scoped GBS does not need to be large to be strategically material.
At the same time, the long tail above 3% (33% of respondents) highlights differing ambition levels and service scope. Organizations in the 3-4% and 4-5% bands (25% combined) are usually those that have expanded beyond classic finance/HR/IT into analytics, procurement, industry operations, or digital product support. The fact that 8% of GBS operate at ≥6% of total enterprise FTEs suggests a subset of enterprises using GBS as a primary operating backbone rather than a functional aggregator. For peers, this indicates that scale is often a deliberate design choice tied to how far the enterprise is willing to globalize work and standardize processes.
“Scale is often a deliberate design choice tied to how far the enterprise is willing to globalize work and standardize processes.”
Overall, GBS models tend to cluster around either “focused efficiency hubs” (<3%) or “scaled enterprise platforms” (≥6%), with fewer organizations sitting in between. This typically reflects governance posture. Companies either constrain GBS scope to protect business-unit autonomy, or they commit to end-to-end global process ownership and migrate work at scale. Leaders evaluating expansion should therefore clarify intent early as incremental growth may stall without a mandate for process standardization and global service management.
For GBS leaders, the practical takeaway is to anchor sizing discussions in value density rather than headcount ratios alone. A 2-3% footprint is consistent with strong maturity if it covers high-volume global processes with automation leverage. Moving toward 4%+ generally requires adding higher-complexity or revenue-proximate services, stronger platform capabilities, and tighter enterprise governance. The benchmark bands in this chart can thus serve as a diagnostic: below 2% may indicate under-penetration, 2-3% reflects typical maturity, and >4% signals a strategic shift toward GBS as an enterprise operating model rather than a support construct.

SSON Research & Analytics is the leading global data and research platform for the Shared Services and GBS industry. Built on insights from the world's largest and most established community of business services professionals, we deliver the metrics, benchmarks, insights, and advisory that drive performance worldwide.